































Recent Entries
 | OLMEC's expected goals Posted by |
Curious as to just how much OLMEC hates you?
I've been posting about expected goals (xg) on some match reports recently and now you too can unleash the "formula of unluckiness."
The formula is (1 - GK save %) * (1 - Sweeper %) * (0.65) * (shots on goal) + (pk_modifier)
The 0.65 is the percentage chance the shot is on target. This the probability any specific shot will be a goal, multiplied by the number of shots.
For instance, take the QPR-Port Vale game here.
Before the PK modifier, QPR's expected goals = (1-.8275)*.65*(1-.52)*29 = 1.56
Port Vale's expected goals = (1-.7825)*.65*(1-.66)*9 = 0.43
The PK modifier for PV:
(50+(18*4)-(2*17))*.01*.05*1 = 0.04
The PK modifier for QPR:
(50+(15*4)-(2*19))(.01*.1*5 = 0.36
1.56 + 0.36 = 1.92 and 0.43 + 0.04 = 0.47
So QPR should have won the game, 1.92 goals to 0.47 goals. Instead it was a 1-1 tie in which QPR won in extra time.
We can then QPR was (1-1.92)+(0.47-1) = -1.45 goals unluckier than Port Vale (which in this case is just PV's goals minus QPR's goals.)
The most extreme instance I can find of this is the Coventry 0-4 Blyth Spartans match. The teams were almost exactly equal with Coventry with a few points more of home advantage. The expected goals were:
COV: 1.21 + 0.37 = 1.58
BLY: 0.97 + 0.37 = 1.34
So Coventry's luck, having lost 4-0, is (0-1.21)+(1.34-4) = -3.87 goals worse off than they otherwise should have been. Not only should they have scored a little more than one goal, they should have given up a little more than one goal.
I've been cheating a bit and not including the penalty kicks in the score at times, but if you ever think OLMEC may have pulled a fast one on you, always check the expected goals. (Would also be a neat "luckiest team" stats feature to add for the future, Al.)
Readers Comments

Can't have that or we would either always be top or bottom of the table on Olmec's whim.
What is the expected goals for giving up a penalty with no hardness? Only asking as we did in both league games (lost 1-0 and won 2-1)
It depends on your keeper and their penalty kicker, but it's the minimum xG for each team: about 0.04 a game, or one penalty kick goal for every 23 games with no hardness. Giving up two penalty kick goals with no hardness in two consecutive games is a 1 in 725 chance.
xG NOT 0.09-0.605 WAT
xG NOT 3.21-0.957 PLY
xG NOT 0.497-0.475 WSM
So Forest were -1.27 goals short of "average" this session (obviously we're comparing integers and fractions but it's still a good metric)

Great analysis John, thank you.
I have a table that I've been storing data in since season 12 that may be capturing some of this. I haven't exposed it in any web pages (originally the idea was to make it an improved 'preview' type set of info I think).
Attached are some samples. Is this the type of data needed for this? Note a field with "B" and "A". I think that is the Before/After values whereby After includes any injuries and sending off type events that would lower SL.
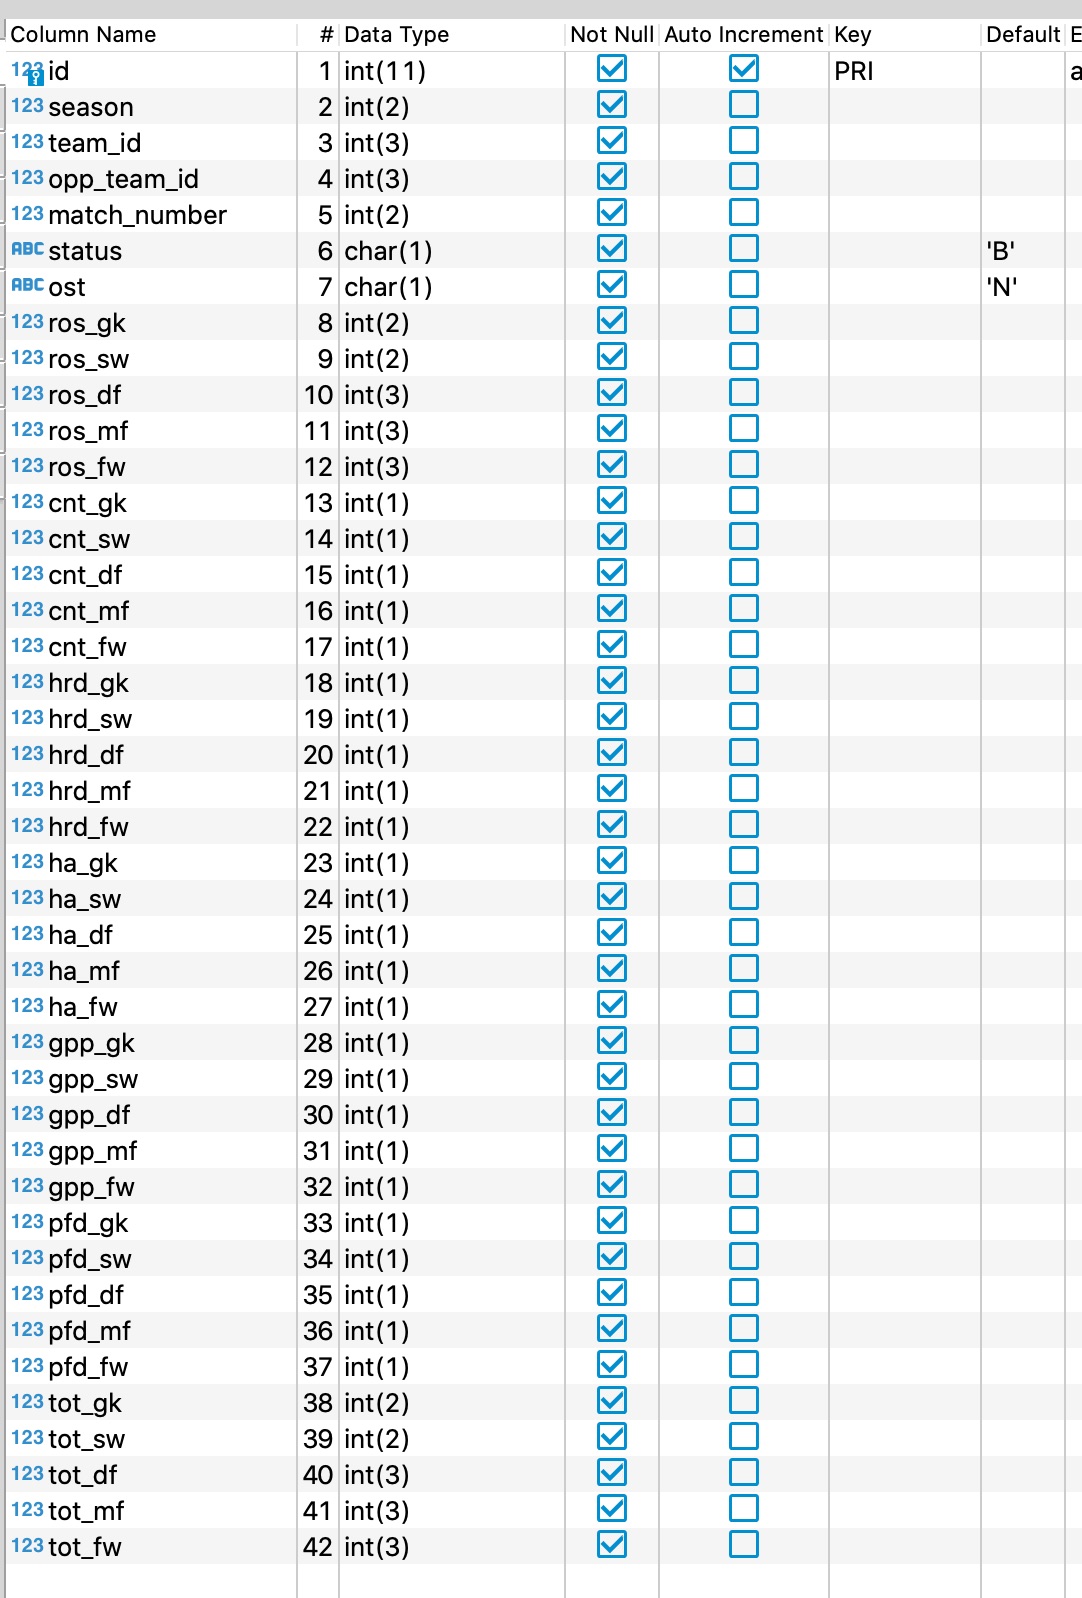


Only thing that's missing is the highest outfield player value, but apart from that it should be easy to do from here. Only additional issue is the fact the shot off target modifier isn't static.

OLMEC sent me a case of root beer. Root beer heals all wounds.

How soon in your U1 career is it acceptable to start to think that OLMEC hates you?

It's funny how so many people think that Olmec hates them... you're all WRONG! It's me that Olmec really hates!
I'd say I made par this session, so will park my paranoia (for the moment). Maybe it was just tough love all along....